7 Measurement, profiling and fair comparisons
A GPU function can look fast or slow when its input shape, warmup, or timing boundary changes. GPU execution is asynchronous with respect to Python: a host timer can stop before queued device work finishes. First measure a known tensor operation, read the profiler result, and state exactly which work completed inside the measured interval.
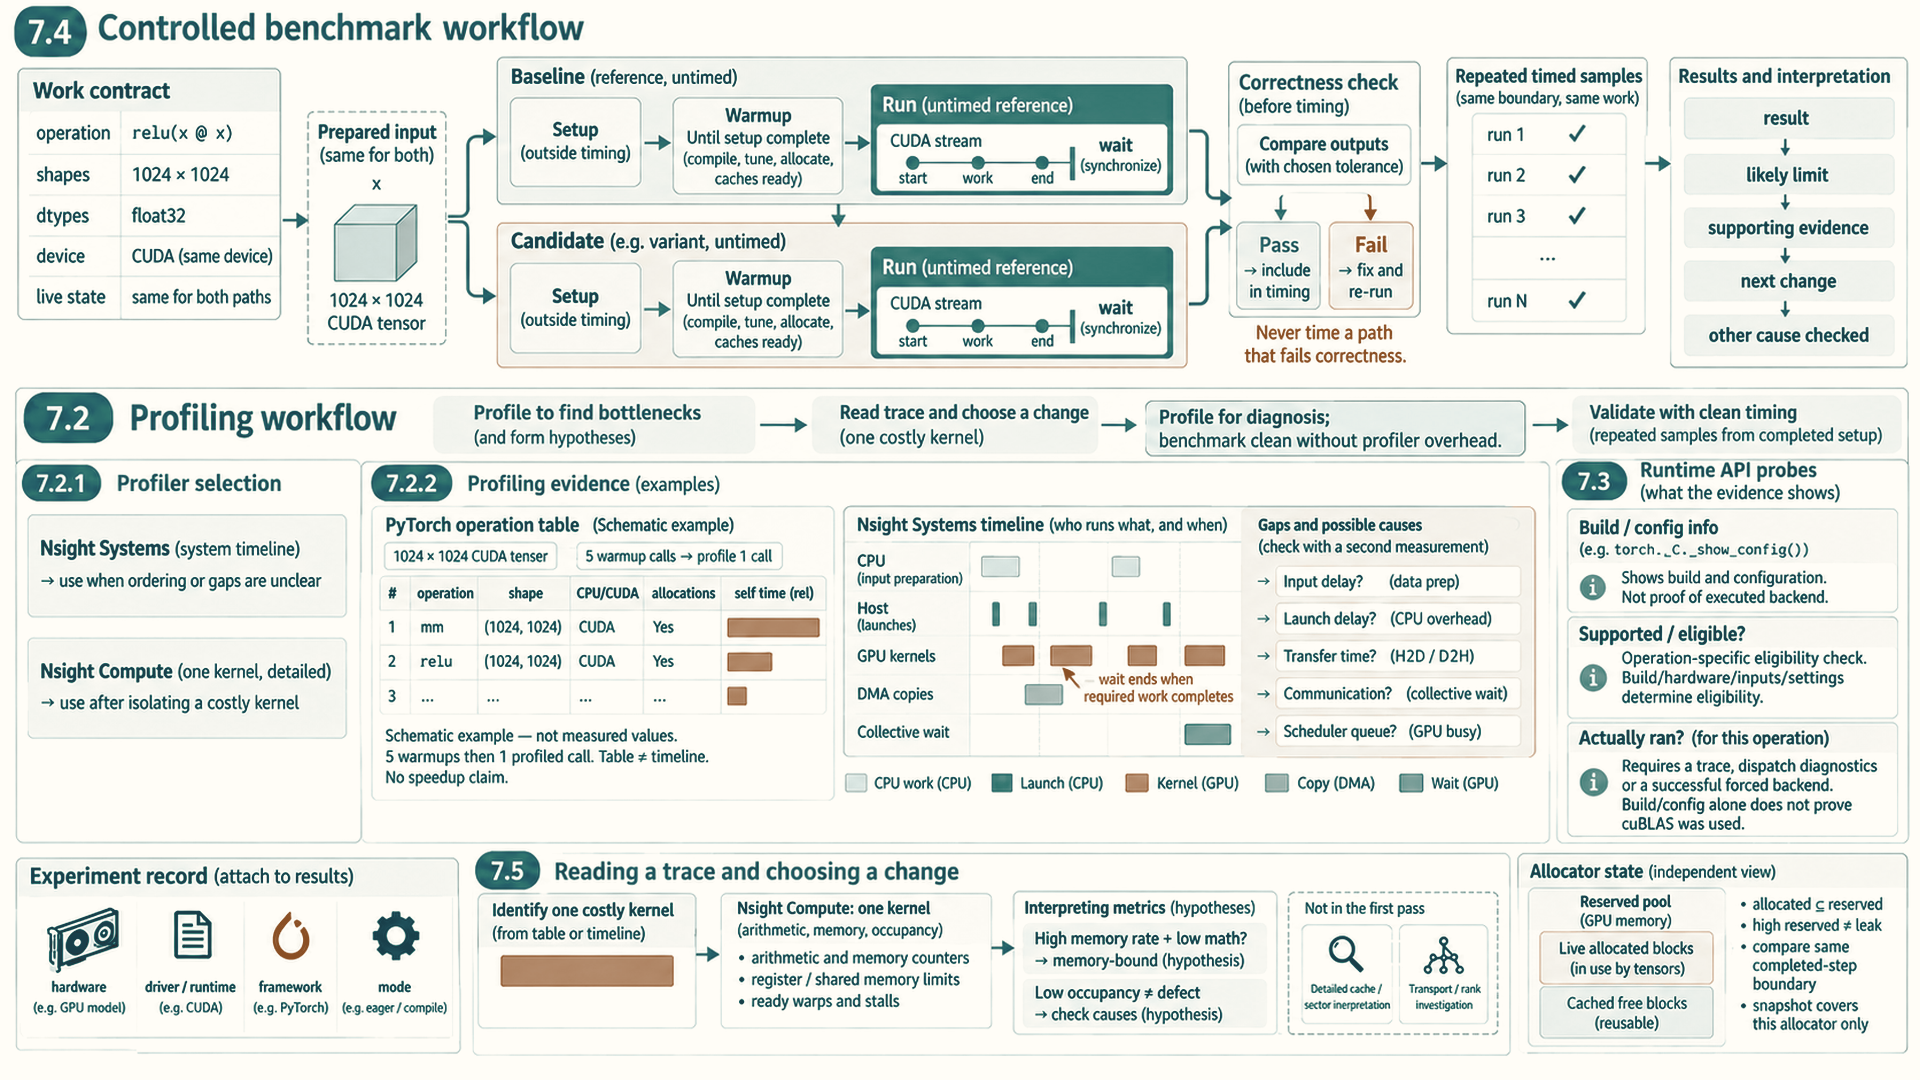
For a later speed comparison, keep the work and inputs comparable, check the output, warm both paths, and repeat the same completed-work timing boundary. More complex training, serving, and distributed tests use the same rule, with their own correctness and workload contracts introduced alongside those tasks. This chapter supplies the common measurement method and a runnable first profiler pass.
7.1 Finding bottlenecks
Procedure: Measurement workflow
A measurement record connects one region of work to evidence and a next decision. For the first profiler pass below, the region is a warmed matrix multiplication followed by ReLU on known tensors. The method also applies when a later chapter supplies a model, request stream, or group of GPU workers.
- Name the work and inputs: Record the operation, tensor shapes, dtypes, devices, and any live state that changes the result or memory footprint.
- Choose the measured result: Use completed elapsed time for this operation. Other tasks may need step time, throughput, request latency, or memory headroom, each with its own boundary.
- Select evidence: Begin with a PyTorch profiler table for framework and device activity. Use a system timeline for launch and copy gaps, or a kernel profiler only after one kernel is isolated.
- Read a likely limit: Compare the observed kernel, transfer, host, or wait time with the work, bytes, and hardware limits from the preceding chapter.
- Choose one change and validate it: Keep the same useful work, check its result, warm both paths, and compare repeated completed-work measurements. A later task also checks its own quality, cache, or worker-participation rule.
For the first listing below, the record can say: one 1024 by 1024 tensor on CUDA enters relu(x @ x), five untimed calls warm the path, and the profiler ranks the operations in one recorded call. A costly matrix-multiply row points to a kernel worth examining. It does not tell us that launch gaps dominate, because a sorted table has no timeline. There is no candidate optimization or speedup claim in this first pass.
Where to look first: Once a symptom is measured, locate the component that can change it. These first-use checks concern tensor placement, completed GPU time, and one costly kernel. Later runtime, serving, and distributed chapters add their own controls when those symptoms appear.
Device or dtype confusion: Initial evidence comes from PyTorch tensor metadata and
torch.cuda: device placement, dtype, memory footprint, and PyTorch backend flags identify the relevant model setting.Suspicious GPU timing: CUDA events are markers recorded in a GPU stream; waiting for the end marker to complete lets an event timer report the GPU time between two markers. Events or profiler timelines can measure completed GPU work. CPU timers without synchronization often measure launch queuing or unrelated host work.
One kernel dominates the trace: Kernel-level evidence comes from Nsight Compute,
Tritonkernel code (a Python-based GPU kernel language, Chapter 5),cuBLAS/cuBLASLt(NVIDIA’s matrix-multiplication libraries) path selection, attention-backend selection, or memory-coalescing analysis. Chapter 5 develops Triton kernels and their measurement context.
The preceding chapters connected tensors and GPU hardware to these symptoms. The next profiler pass shows how to find a costly operation before deciding which lower-level tool is needed.
7.2 Profiling workflow
When the slow layer is not yet known, profiling connects a visible delay to the framework operation, kernel, copy, or host wait that produced it. PyTorch Profiler connects framework operations with CPU time, CUDA activity, shapes, and allocations1. Nsight Systems then reveals launch ordering and idle gaps2, while Nsight Compute applies after a specific kernel has been isolated3.
Example: PyTorch profiler pass
This first runnable profile measures CPU and CUDA activity for a warmed matrix multiplication and ReLU. Warmup avoids mixing initialization with steady-state timing. Sorting the table by CUDA time identifies operations that dominate device time. profile_memory=True also reports allocation activity. The table ranks work inside this example; it does not show a full launch timeline or establish an end-to-end speedup.
CUDA setup: This template requires a supported NVIDIA GPU and driver and a CUDA-enabled PyTorch build. Check torch.cuda.is_available() before allocating CUDA tensors. It does not require Triton. Record versions using Appendix A.3, Compatibility checks.
Code example: PyTorch profiler pass
import torch
from torch.profiler import profile, ProfilerActivity

device = torch.device("cuda", 0)
args = (torch.randn(1024, 1024, device=device),)

def fn(x):
    return torch.relu(x @ x)

for _ in range(5):
    fn(*args)  # warmup
torch.cuda.synchronize()

with profile(
    activities=[ProfilerActivity.CPU, ProfilerActivity.CUDA],
    record_shapes=True,
    profile_memory=True,
) as prof:
    fn(*args)

print(prof.key_averages().table(sort_by="cuda_time_total", row_limit=20))
The listing runs several unmeasured warmup iterations and synchronizes before profiling. PyTorch then records operation time, shapes, and allocation activity for this known tensor function. Read the printed rows as a ranking of work in the profiled region. If a row raises a question about gaps or overlap, inspect a timeline next; the aggregate table cannot answer that question by itself.
7.2.1 Profiler selection
Different profilers answer different questions. Start with the cheapest tool that can disprove the current guess, then move to lower-level tools only when more detail is needed.
- Python profilers:
cProfiledeterministically records Python function calls and their timings, whilepy-spyperiodically samples a running Python process with low intrusion. Both are useful for tokenization, request formatting, Python scheduling, and data-loader work, but they collect evidence differently. - Event or tracing profiler: Records timed events and relationships. PyTorch Profiler links framework operations to CPU time, CUDA kernels, memory, and shapes4. Nsight Systems records a system timeline with CUDA launches, kernels, memory copies, NVTX ranges (named time spans that application code inserts into a trace), and collectives5.
- Kernel profiler: Inspects one GPU kernel in detail. Nsight Compute (NCU) reports occupancy, memory transactions, instruction mix, tensor-core usage, achieved bandwidth, and stall reasons6.
- Trace viewer: Perfetto (a browser-based trace viewer) or Chrome trace viewing helps inspect exported timelines interactively, especially repeated decode steps and CPU/GPU gaps.
Profiling adds overhead. It can change timing, perturb scheduling, and force extra synchronization. Treat profiled runs as diagnostic evidence, not final benchmark numbers. Once the bottleneck is identified, measure a clean steady-state run without heavy profiling instrumentation. Section 7.4 gives the full benchmarking procedure: warmup, fixed shapes, synchronized timing, correctness checks, and repeated samples.
The trace patterns are observations to connect to the bottleneck classes in Section 6.1. A synchronization wait inherits the cause of the work being waited for. Copies may concern input delivery, host transfers, or communication between devices. CPU work may concern input preparation, dispatch, or serving scheduling. The timeline and a second measurement identify which cause sets the duration.
- Compute-bound trace: Long GPU kernels with high arithmetic utilization, little idle gap, and evidence of tensor-core or math throughput limits.
- Memory-bound trace: Runtime tracks bytes moved. Kernels show high memory throughput but lower arithmetic utilization, often visible in decode or KV-cache-heavy paths.
- Synchronization-bound trace: CUDA synchronizations, blocking copies, or collectives create wait regions where useful GPU work cannot proceed.
- Transfer-bound trace: Host-to-device, device-to-host, or device-to-device copies occupy visible timeline spans and block the hot path.
- CPU/data-bound trace: GPU sits idle while the host handles tokenization, data loading, JSON parsing, sampling, or scheduler bookkeeping.
- Launch-bound trace: Many tiny kernels are separated by CPU launch gaps. Fusion,
torch.compile, or CUDA Graphs may help if shapes and control flow are stable.
After selecting the tool, the next question is how one costly framework operation maps to the specific GPU kernel, copy, or host wait that produced its time.
From a framework operation to its kernel: A row in the profiler table groups time by PyTorch operation. To explain a costly row, use a timeline to see the CUDA kernels and copies it launched, then isolate a specific kernel only if its own memory or arithmetic behavior is still unclear. The printed table in the first example gives a starting rank of operations; it does not by itself show launch gaps or overlap.
7.2.2 Profiler symptoms
A profiler result is evidence from a trace or kernel report that points toward a bottleneck. It is not a final answer by itself. The same visible pattern can have several causes, so the useful workflow is to connect the result to the layer that produced it, then confirm with a second measurement.
- GPU gaps between kernels: The device timeline has idle spaces between short kernels. Common causes are CPU launch overhead, Python scheduling, implicit synchronization, data-dependent control flow, or a serving scheduler that cannot feed work fast enough. Confirm with Nsight Systems or a PyTorch Profiler timeline before rewriting kernels.
- High memory throughput with low math utilization: The kernel is likely memory-bound. The next question is which bytes dominate: HBM reads, cache misses, uncoalesced global loads, key-value cache reads, or host-device copies.
- Low occupancy: Too few warps are resident on each Streaming Multiprocessor (SM), or the kernel is limited by registers, shared memory, block size, or launch shape. Low occupancy is not always a bug. Some kernels are intentionally limited by another resource.
- Many tiny kernels: The workload may be launch-bound or suffering from graph fragmentation. First check whether fusion,
torch.compile, or CUDA Graph replay can remove repeated host-side overhead. - Long memory-copy spans: The trace is spending time moving data rather than computing. Distinguish CPU-to-GPU transfer, GPU-to-CPU transfer, peer-to-peer GPU transfer, and network transfer because each has a different fix.
- High cache-sector traffic: Nsight Compute may show that a kernel requests many L1 or L2 sectors for little useful payload7. This usually points to poor coalescing, scattered strides, low spatial locality, or streaming data that is too large to reuse from cache. If sectors per request look reasonable but hit rate is still poor, check reuse distance, working-set size, and possible conflict patterns from stride or layout. Read counters by level: L1/TEX symptoms suggest per-SM access-pattern issues. L2 misses to device memory suggest HBM traffic. L2 misses to peer or system memory suggest remote or mapped-memory paths.
- Long collective spans: A distributed step may be communication-bound. Check whether ranks arrive late, whether NCCL used the expected fabric, and whether overlap with backward or layer computation is actually hiding the collective.
- Allocator spikes: Repeated allocation or fragmentation can appear as CPU overhead, device synchronization, or memory-pressure stalls. Reuse buffers, stabilize shapes, or inspect PyTorch allocator statistics before assuming the math kernel is slow.
Once a trace isolates one slow kernel, Nsight Compute separates its throughput ceiling, memory behavior, warp scheduling, launch shape, and source-level instruction cost8. The table groups the report views by the question they answer.
| Nsight Compute view | What it answers | Example metric family to inspect |
|---|---|---|
| Speed of Light / SOL | How close the kernel is to compute and memory ceilings. | SM throughput, DRAM throughput, achieved occupancy, and roofline-like utilization summaries. |
| Memory Workload Analysis | Which memory level and transaction pattern dominate. | L1/TEX sectors, L2 hit rate, DRAM bytes, sector counts, and shared-memory table entries. |
| Scheduler and warp state | Why warps were not issuing instructions. | Warp stall reasons such as memory dependency, barrier, not selected, or execution dependency. |
| Launch statistics | Whether launch shape and resources limit parallelism. | Grid/block dimensions, registers per thread, shared memory per block, theoretical occupancy. |
| Source counters | Which source lines or instructions create the traffic. | PC sampling, instruction mix, tensor-core instructions, local-memory loads/stores from spills. |
Profiler output is a map of hypotheses. A PyTorch table can say which operator is expensive, Nsight Systems can show whether the GPU is idle or communicating, and Nsight Compute can explain one kernel’s memory transactions and occupancy. Jumping directly from one table row to a rewrite is a common source of wasted optimization work.
7.3 Runtime API probes
A runtime API probe asks one narrow question. The CUDA event example below measures one warmed matrix multiplication on a stream; allocator counters answer how much PyTorch tensor storage is live and how much capacity its allocator holds. These probes complement the aggregate profiler table without requiring a model checkpoint, tokenizer, service, or distributed launch.
A probe should lead to a more specific question only when its first result leaves a real uncertainty. Compiler graph-break diagnostics appear in the next chapter, after the compiler path is explained.
CUDA setup: The CUDA listings require a supported NVIDIA GPU and driver and a CUDA-enabled PyTorch build. Check torch.cuda.is_available() before running them. They do not require Triton. Record versions using Appendix A.3, Compatibility checks.
Example: CUDA event timing
This probe measures elapsed time on the CUDA stream rather than trusting an unsynchronized CPU timer. It places input allocation and warmup outside the measured region. The expression y = x @ w still creates an output tensor between the events, so this probe measures that operation’s stream interval rather than isolating arithmetic alone. CUDA launches are asynchronous from the CPU side, so CPU wall-clock timing can accidentally measure queueing rather than device execution. Events measure work between markers on a stream. They still need synchronization before reading elapsed time.
Code example: CUDA event timing
import torch

device = torch.device("cuda", 0)
x = torch.randn(4096, 4096, device=device, dtype=torch.float16)
w = torch.randn(4096, 4096, device=device, dtype=torch.float16)

for _ in range(5):
    _ = x @ w
torch.cuda.synchronize()

start = torch.cuda.Event(enable_timing=True)
end = torch.cuda.Event(enable_timing=True)

start.record()
y = x @ w
end.record()

torch.cuda.synchronize()
print(start.elapsed_time(end), "ms")
Result: The event pair reports elapsed milliseconds after the end event completes. It measures the matrix multiplication’s device-stream interval, including output writes and any exposed gaps. Output allocation is requested between the host record calls, but the events do not separately measure its full CPU cost. Input allocation and warmup are outside this interval. This is a timing probe, not a measured speedup.
When GPU memory remains occupied after a step, a memory snapshot records the state of PyTorch’s CUDA memory allocator at that point. torch.cuda.memory_snapshot() supplies that state. The simpler torch.cuda.memory_allocated() counter reports memory occupied by tensors, while torch.cuda.memory_reserved() includes unused memory retained by the caching allocator.9 Comparing these counters at the same completed-step boundary helps distinguish live tensor storage from reserved capacity. High reserved memory alone does not establish a leak. The snapshot supports investigation of allocation patterns; it is not a kernel-timing trace or a measurement of all GPU allocations outside PyTorch’s allocator.
7.4 Controlled benchmark workflow
A valid comparison holds the workload, tensor shapes, software versions, and timing boundary constant. Framework warmup occurs separately so compilation and allocation do not enter the steady-state measurement.
Procedure: Measurement pass
Start with runnable code for the operation under study and a clear timing boundary. When comparing a proposed change, add a baseline and candidate over the same prepared workload, plus a reference result or correctness rule with any numerical tolerance chosen in advance. The outcome is a comparison record following the earlier measurement workflow.
- State the suspected limiting resource and the metric that would show an improvement.
- Record the hardware, software, launch settings, inputs, and workload sizes for both paths.
- Fix the tensor shapes, or specify the same shape distribution for both paths when variation is the factor under test.
- Run unmeasured warmup until compilation, autotuning, allocation, and required cache setup finish. Complete warmup work on every relevant device before timed samples begin.
- Check the outputs, cache updates, gradients, or rank participation required by this experiment against the prepared reference or rule. Do not time a path that fails its check.
- Collect repeated samples of completed work using the same boundary for both paths: CUDA events for the chosen device-stream interval, or synchronized wall time for the full operation being compared.
- Compare baseline and candidate results, record the evidence for the supported bottleneck, and choose at most one next change. If the evidence is inconclusive, record that limit.
Environment and version logging:
- Hardware identity: GPU model, GPU count, memory capacity, interconnect, CPU model, and node shape.
- Driver/runtime identity: NVIDIA driver, CUDA runtime visible to PyTorch, cuDNN or attention backend versions when relevant.
- Framework identity: Python, PyTorch, Triton kernel-language/compiler, Transformers, serving engine, and distributed framework versions.
- Execution mode: Whether the run used eager execution,
torch.compile, CUDA Graphs, quantization, custom kernels, or a serving-engine backend.
Kernel availability and compiler behavior depend on these versions. Record the fields relevant to the operation under test and mark unavailable packages explicitly. A later model or distributed experiment adds its model revision, topology, container, and launch settings.
Backend availability also depends on the build, hardware, inputs, and runtime settings. An eligibility check tests whether a path can run; an execution trace, dispatch diagnostic, or successfully forced backend confirms which path ran. Environment variables record device visibility and rank placement. A final experiment record should also include model revision, input-shape distribution, precision, compiler mode, cache settings, launch command, and the profiler or timing method.
Warmup policy and shape control:
- Warmup count: Enough unmeasured iterations to trigger compilation, autotuning, allocator growth, and cache creation.
- Static-shape experiment: Keeps shapes fixed to isolate kernel, compiler, or CUDA Graph behavior.
- Variable-shape experiment: Uses a controlled distribution of lengths or batch shapes to test scheduler and compiler behavior under realistic variability.
- Shape drift: An accidental change in tensor dimensions between runs, often causing recompilation or different kernel selection.
Shape control determines which tensor dimensions vary during a benchmark: batch size, sequence length, hidden width, head dimension and the mix of prefill and decode tokens. Compilation, CUDA Graph replay, attention kernels and serving schedulers can specialize to these dimensions. A variable-shape comparison uses the same distribution in both paths. The next check is whether each path still computes the intended result across that range.
Correctness checks: A correctness check verifies that the optimized path still computes the intended result. Performance numbers are not useful if a kernel silently drops work, a decode loop corrupts the cache, or a distributed job leaves some ranks out of the computation.
- Custom kernel: A PyTorch reference supplies expected outputs. The experiment chooses a tolerance appropriate to the dtype, operation, and error budget.
torch.allclose provides a simple floating-point comparison when an optimized tensor output should match an eager reference. This abbreviated snippet expects optimized_output and eager_reference to be same-shaped tensors on the same device and with the same dtype. When storage precisions differ, explicitly convert the lower-precision output to the reference dtype before this comparison; conversion does not recover precision already lost. Its input is that tensor pair, and its result is assertion success or failure. For finite output and reference values \(a\) and \(b\), the condition is \(|a-b|\leq10^{-3}+10^{-3}|b|\). NaNs fail this default comparison10:
Code example: Floating-point correctness check
import torch

# Verify optimized output matches eager reference within tolerance
assert torch.allclose(optimized_output, eager_reference, rtol=1e-3, atol=1e-3), \
    f"Mismatch! Max absolute difference: {(optimized_output - eager_reference).abs().max()}"
Tolerance is part of the correctness contract. A fused or lower-precision path may differ bit-for-bit from a reference path, so the allowed error must be chosen before timing and before any surprising speedup appears.
Benchmark harness structure: A benchmark harness is the wrapper code that prepares inputs, runs warmup, measures the intended region, checks correctness, and reports results. Its job is to make the measurement reproducible and to keep setup or teardown work out of the timing window.
A small harness should separate responsibilities instead of hiding them inside one timing block:
- Setup: Inputs, the model or engine, and the device are constructed before the measured region.
- Warmup: Unmeasured iterations initialize kernels, compilation paths, caches, and allocator state.
- Measurement: The timed region answers the bottleneck question and excludes setup.
- Synchronization:
torch.cuda.synchronize()brackets measured CUDA work when wall-clock timing is required.
CUDA events measure elapsed time between two points on a CUDA stream. They omit host work outside that interval, but include idle gaps inside it if the host fails to enqueue the next operation in time. They are appropriate for device-stream timing rather than end-to-end latency11. The earlier event probe creates its own tensors, warms the operation, and synchronizes the end event before reading elapsed milliseconds.
Profiler selection guide: Choose a profiler that can observe the suspected source of delay. Profiler selection (Section 7.2.1) compares PyTorch Profiler, Nsight Systems, Nsight Compute, and Perfetto by the question each answers.
Interpretation template: Reading results means connecting the measurement to a bottleneck class. A useful result note contains five parts:
A result note must state what was measured, what likely limits it, the evidence for that cause, the smallest next change, and another plausible cause checked. This ties a proposed change to a measurement rather than to an isolated profiler number.
- Measured result: What the profiler, benchmark, or trace actually showed.
- Likely bound: Memory-bound, compute-bound, launch-bound, communication-bound, or scheduler-bound.
- Supporting evidence: The counter, trace region, timeline gap, or formula that supports the suspected cause.
- Next change: The smallest change that should move the identified bottleneck.
- Other cause checked: The other plausible cause considered and the evidence that points elsewhere.
A good result note states what happened, what should change next, and what evidence would disprove that next step.
The template is completed immediately after the run while the trace, command line, and environment log are still available. Otherwise the result becomes difficult to compare with the next experiment.
Reliable measurement: Reliable GPU measurement matches the timing method to the question being asked. The following checklist keeps Python timing, asynchronous CUDA execution, first-run compilation, shape variation, and scheduler effects from changing the measured quantity.
Checklist: Reliable measurement
Wall-clock GPU timing is synchronized when the metric is device execution time.
First-run compilation or autotuning is reported separately from steady-state latency.
Tensor shapes remain fixed when one change is compared, or shape variation is reported as an independent factor.
Expected workload sizes expose the target memory pressure or communication overhead.
Multiple repeated samples provide statistics rather than a single trial.
Timeline and stream dependencies establish copy, communication, and compute overlap.
GPU clocks, power limits, and throttling events are recorded, and clocks are locked for microbenchmarks where the system permits it.
GPU clocks are a hidden variable. A GPU raises and lowers its clock with temperature and power draw, so two runs of the same kernel can differ because one was throttled. nvidia-smi can lock the GPU clock to a fixed range (--lock-gpu-clocks) and set a power limit (--power-limit), both of which need administrator rights, and its clock-event reasons report when the software power cap or a thermal slowdown reduced the clock.12 A microbenchmark that compares two kernels runs at locked clocks where permitted. An end-to-end benchmark records the clocks and throttle reasons it saw, because production runs at whatever clock the hardware chooses.
Runtime setup and launch configuration:
CUDA_VISIBLE_DEVICEScontrols which GPUs the process can see and how they are enumerated.PYTORCH_CUDA_ALLOC_CONFchanges caching allocator behavior and is useful when fragmentation is suspected.
Recurring experiment patterns: Several experiment shapes recur across performance work. They differ in the measured object, but they share the same discipline: establish a baseline, change one mechanism, verify the output, and explain the result using evidence from the appropriate software and hardware layer.
Roofline exercise pattern: The exercise counts FLOPs, estimates HBM bytes, measures steady-state time, computes arithmetic intensity, compares bandwidth and compute ceilings, and explains any contradiction.
Compile and CUDA Graph pattern: The pattern warms up, identifies graph breaks, stabilizes shapes and memory addresses, captures only steady GPU work, replays it, and compares it with eager execution without including compile time.
7.5 Reading a trace and choosing a change
Waiting has different causes. A launch-bound GPU waits between kernels for host dispatch, whereas an input-bound run waits for data loading, tokenization, or other host preparation. Communication-bound work waits on transfers or synchronization between GPUs or nodes. In serving, scheduler-bound requests wait for admission or batching. A capacity-bound workload cannot fit its live state in available memory, or fits only with a smaller batch. These causes require different evidence even when each appears as waiting on a timeline.
An optimization lever is the kind of change a technique makes. Fewer operations can shorten arithmetic; fewer transferred bytes can shorten memory traffic. A faster supported instruction path or more parallel work can raise the arithmetic rate, while fewer launches can shorten host overhead. Reducing resident state or wasted allocation addresses capacity. KV-cache paging reduces allocation waste without shrinking the logical keys and values for a fixed workload (Section 12.5). Adding devices shares work at a communication cost. The useful lever therefore follows from the measured cause: batching may improve hardware use but make capacity pressure worse, and a faster kernel cannot directly repair slow input preparation. The two tables below collect the classes, evidence, and levers for reference.
| Class | What sets the duration | Typical evidence | Developed in |
|---|---|---|---|
| Compute-bound | Arithmetic throughput for the selected instruction and kernel path | High Tensor Core or math utilization, with runtime following FLOPs | Section 6.2, Chapter 7 |
| Memory-bound | Bytes moved to and from memory at the bandwidth limit | High achieved bandwidth, low math utilization | Section 6.2, Chapter 7 and Chapter 12 |
| Latency-bound | Too little parallel work to hide memory or instruction delays, so neither compute nor bandwidth is near its limit | Small shapes, low occupancy (few active thread groups per GPU processing unit, Section 3.1), short kernels | Section 3.1, Section 7.2 |
| Launch-bound | CPU dispatch and kernel launch time, with the GPU waiting between kernels | Idle gaps between short kernels on a timeline | Chapter 4, Chapter 7 and Chapter 8 |
| Input-bound | Data loading, tokenization, or other host preparation | The GPU waits for the next batch or request | Section 9.3, Section 13.2 |
| Capacity-bound | Memory size: the work does not fit, or fits only at a smaller batch | Out-of-memory errors, admission limits | Section 2.1, Section 10.6, Section 12.5 |
| Communication-bound | Transfers or synchronization between GPUs or nodes | Long collective spans, ranks waiting for each other | Chapter 16 and Chapter 17 |
| Scheduler-bound | Requests waiting for admission or batching rather than for GPU work | Queue time dominates latency | Chapter 13 |
| Lever | What it changes | Examples in this guide |
|---|---|---|
| Do less work | The total operations needed for the workload | KV cache (Section 12.1), prefix caching (Section 13.5), grouped-query attention (Section 10.6), model compression that reduces active weights (Chapter 11) |
| Move fewer bytes | Bytes moved per useful operation | Kernel fusion (Section 8.7), tiled attention such as FlashAttention (Section 5.7), quantization (Chapter 11), memory coalescing (Section 4.6) |
| Use faster hardware paths | The peak rate available | Tensor Cores and shape alignment (Section 3.3), reduced precision (Section 9.4), vendor libraries (Section 4.1) |
| Keep the hardware busy | The fraction of peak achieved | Batching (Section 13.2), speculative decoding (parallel target verification, with added draft and verification arithmetic; Section 14.1), overlapping copies and communication with compute (Section 4.3, Section 17.2), chunked prefill (Section 13.3) |
| Cut fixed overhead | Host and launch time per step | Compilation and CUDA Graphs (Chapter 8), scheduler work off the hot path (Section 13.2.2) |
| Fit in memory | Resident state and wasted allocation | Activation checkpointing (Section 9.2), KV-cache paging to reduce allocation waste (Section 12.5), sharding (Section 18.4) |
| Scale out | The number of devices, at a communication cost | Data, tensor, pipeline, and expert parallelism (Chapter 18, Chapter 19, and Chapter 20), separate prefill and decode workers (Section 13.4, with distributed KV handoff and locality in Section 21.2) |
A profiler must observe the layer where the suspected delay is created. Framework operations, system scheduling, individual kernel behavior, serving queues, and distributed transports require different evidence even when they appear in one end-to-end request.
The escalation path below starts with the application vocabulary and moves downward only when the current evidence isolates a narrower question.
The table shows what each profiler or trace viewer can establish and what to do next.
| Question layer | Primary evidence | What it can establish | Next escalation |
|---|---|---|---|
| PyTorch operation | PyTorch Profiler | Expensive operations, dimensions, memory events, and the CPU/CUDA time split | Nsight Systems when timeline ordering is unclear |
| CPU/GPU timeline | Nsight Systems with NVTX ranges | Launch gaps, copies, synchronization, kernel order, and collective spans | Nsight Compute after one kernel is isolated |
| GPU kernel | Nsight Compute | Occupancy, transactions, cache sectors, instruction mix, tensor-core use, and stalls | Source or kernel rewrite guided by measured counters |
| Exported framework trace | Perfetto | Interactive inspection of repeated steps, ranges, and CPU/GPU gaps | Return to the profiler that records missing events |
NVTX ranges supply application context to timeline tools. Label phases such as tokenization, prefill, decode, sampling, cache management, and communication so a kernel sequence can be connected to the request or training step that launched it.
Serving-engine metrics are developed in Chapter 15 because queueing and cache pressure belong to the serving control plane. NCCL logs and distributed traces are developed in Chapter 17 because transport selection depends on ranks and topology. With the responsible layer selected, the next question is how to read its symptom and confirm it with a second measurement.
References
PyTorch. (2.14 documentation; page created Dec 18, 2020, last updated May 11, 2026). torch.profiler.
torch.profilerAPI reference. Supports that the profiler context manager collects CPU and CUDA activity, that record_shapes saves input shapes, that profile_memory tracks allocation, and that shape tracing adds overhead. Limit: API flags and CUPTI behavior can change by release; the chapter uses the stable option names only.↩︎NVIDIA. (n.d.). Nsight Systems User Guide. Nsight Systems User Guide. Supports that Nsight Systems records a system timeline with CUDA launches, kernels, memory copies, NVTX ranges, and collectives such as NCCL. Limit: trace options and driver requirements vary by tool version; exact event names should be confirmed in the installed guide.↩︎
NVIDIA. (n.d.). Nsight Compute Profiling Guide. Nsight Compute Profiling Guide. Supports per-kernel inspection with launch statistics, memory workload analysis, scheduler and warp-state views, and source counters including sector, occupancy, and stall families. Limit: exact counter and view names vary by GPU architecture and tool version, as the chapter states.↩︎
PyTorch. (2.14 documentation; page created Dec 18, 2020, last updated May 11, 2026). torch.profiler.
torch.profilerAPI reference. Supports that the profiler context manager collects CPU and CUDA activity, that record_shapes saves input shapes, that profile_memory tracks allocation, and that shape tracing adds overhead. Limit: API flags and CUPTI behavior can change by release; the chapter uses the stable option names only.↩︎NVIDIA. (n.d.). Nsight Systems User Guide. Nsight Systems User Guide. Supports that Nsight Systems records a system timeline with CUDA launches, kernels, memory copies, NVTX ranges, and collectives such as NCCL. Limit: trace options and driver requirements vary by tool version; exact event names should be confirmed in the installed guide.↩︎
NVIDIA. (n.d.). Nsight Compute Profiling Guide. Nsight Compute Profiling Guide. Supports per-kernel inspection with launch statistics, memory workload analysis, scheduler and warp-state views, and source counters including sector, occupancy, and stall families. Limit: exact counter and view names vary by GPU architecture and tool version, as the chapter states.↩︎
NVIDIA. (n.d.). Nsight Compute Profiling Guide. Nsight Compute Profiling Guide. Supports per-kernel inspection with launch statistics, memory workload analysis, scheduler and warp-state views, and source counters including sector, occupancy, and stall families. Limit: exact counter and view names vary by GPU architecture and tool version, as the chapter states.↩︎
NVIDIA. (n.d.). Nsight Compute Profiling Guide. Nsight Compute Profiling Guide. Supports per-kernel inspection with launch statistics, memory workload analysis, scheduler and warp-state views, and source counters including sector, occupancy, and stall families. Limit: exact counter and view names vary by GPU architecture and tool version, as the chapter states.↩︎
PyTorch. (2.14 documentation). CUDA semantics, Memory management. Allocator state and memory counters. Supports allocator snapshots and the distinction between tensor allocation and cached reserved memory. Comparing repeated step boundaries is a diagnostic use of those counters, not proof of a leak or a complete account of other libraries’ allocations.↩︎
PyTorch. (2.14 documentation). torch.allclose. torch.allclose. Defines the elementwise combined absolute-plus-relative tolerance and the default rejection of NaN equality. It does not select a scientifically appropriate tolerance for an experiment.↩︎
PyTorch. (2.14 documentation). CUDA semantics, Asynchronous execution. CUDA semantics. Shows recorded CUDA events and synchronization before reading elapsed time. The measured interval is a stream interval, not a request-level latency measurement.↩︎
NVIDIA. (n.d.). nvidia-smi documentation. NVIDIA nvidia-smi documentation. Supports
--lock-gpu-clocks(Volta and later, root required),--reset-gpu-clocks,--power-limit(root required), and the clock-event reasons SW Power Cap, HW Thermal Slowdown, and SW Thermal Slowdown. Limit: whether clocks can be locked depends on the system and its administrator; cloud instances may not permit it.↩︎